Text, 45 度线,Legend 位置设置
from sklearn.metrics import r2_score
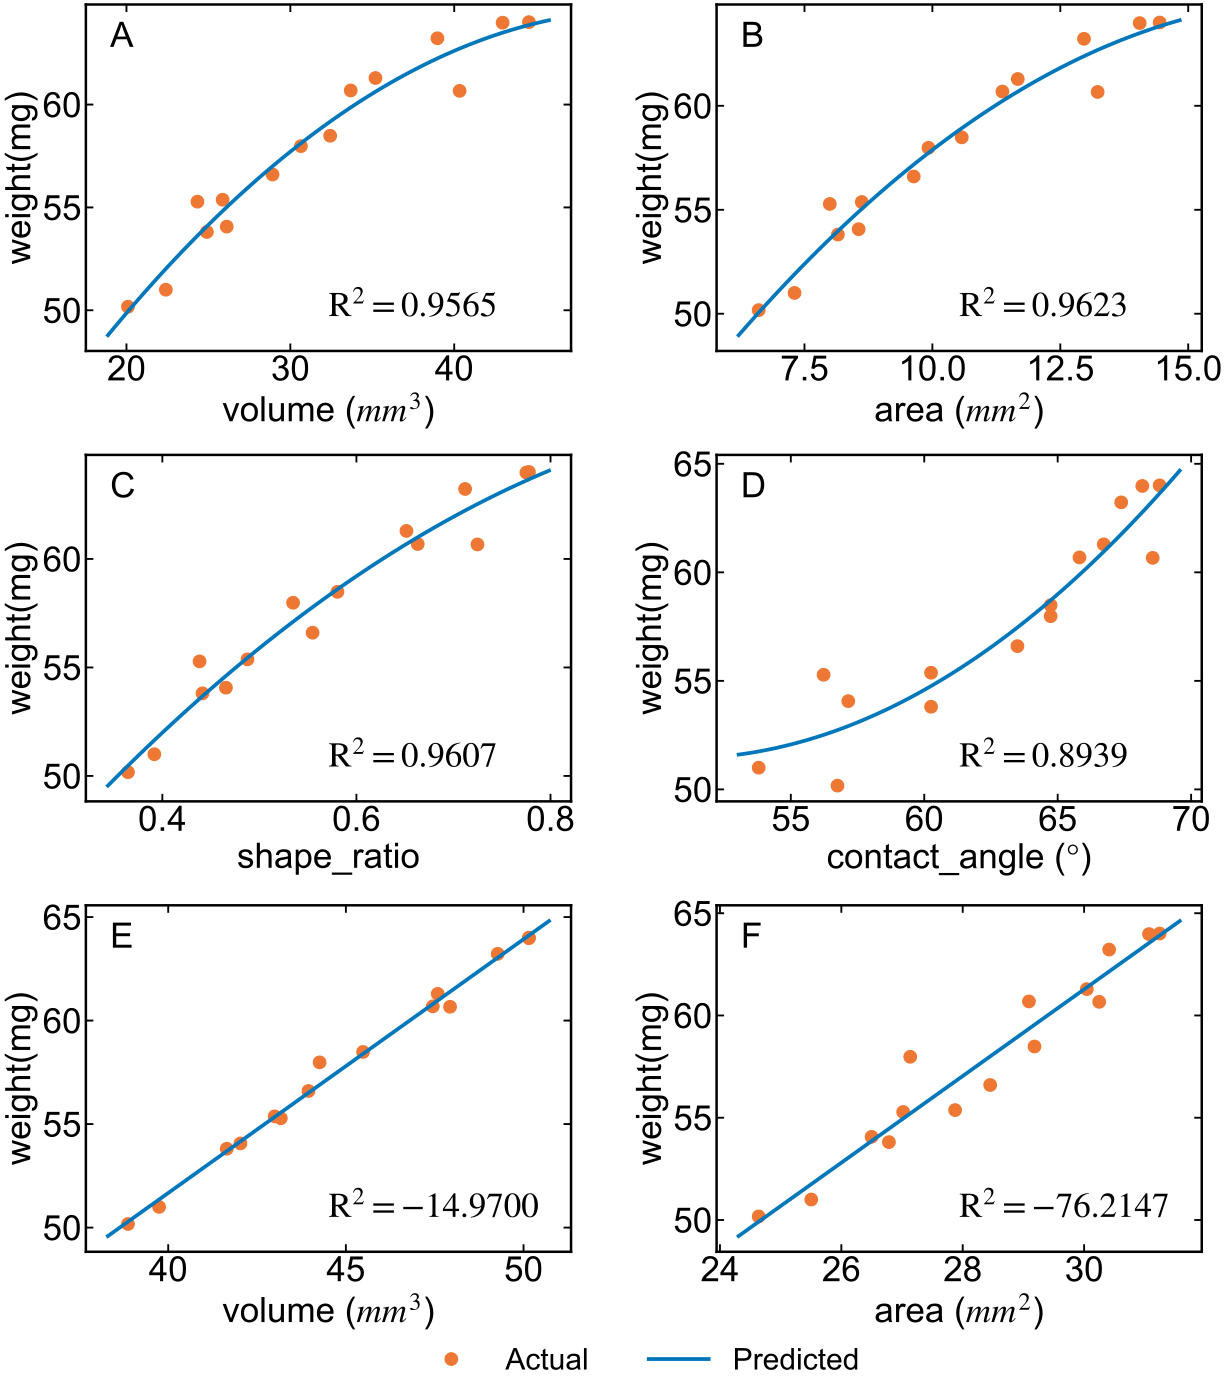
fig, ax = plt.subplots(3, 2, figsize=(16, 18), gridspec_kw={'wspace':0.3, 'hspace':0.3})
# plt.subplots_adjust(hspace=0.25)
feature_list_1 = ['volume', 'area', 'shape_ratio', 'contact_angle']
feature_list_2 = ['volume', 'area']
unit_list_1 = ['$mm^3$', '$mm^2$', ' ', '$\degree$']
marker_list_1 = ['A', 'B', 'C', 'D']
unit_list_2 = ['$mm^3$', '$mm^2$']
marker_list_2 = ['E', 'F']

plt.style.use("default")

plt.style.use("./zs.mplstyle")
# plt.rcParams['xtick.labelsize'] = 20
# plt.rcParams['ytick.labelsize'] = 20
# plt.rcParams['xtick.labelsize'] = 20
# plt.rcParams['axes.labelsize'] = 20
plt.rcParams['xtick.minor.visible'] = False
plt.rcParams['ytick.minor.visible'] = False

for i in range(2):
    for j in range(2):
        _feature_name = feature_list_1[2*i+j]
        _ax = ax[i, j]
        _unit = unit_list_1[2*i+j]
        _marker = marker_list_1[2*i+j]
        feature = feature_df_min[_feature_name]
        func = np.polyfit(feature, weight, 2)
        weight_pred = np.polyval(func, feature_df_min[_feature_name])
        r2 = r2_score(weight, weight_pred)
        _ax.plot(feature, weight, 'o', label='Actual')
        begin, end = _ax.get_xlim()
        curve_x = np.linspace(begin, end, 100)
        curve_y = np.polyval(func, curve_x)
        _ax.plot(curve_x, curve_y, label='Predicted')
        _ax.text(0.05, 0.95, _marker, transform=_ax.transAxes, va='top')  #若用绝对坐标,则不加transform
        _ax.set_ylabel("weight(mg)")
        _ax.text(0.5, 0.1, r"${\rm R^2=}$" + f"${r2:.4f}$", transform=_ax.transAxes)
        if _unit != ' ':
            _ax.set_xlabel(f"{_feature_name} ({_unit})")
        else:
            _ax.set_xlabel(f"{_feature_name}")

for j in range(2):
    _feature_name = feature_list_2[j]
    _ax = ax[2, j]
    _unit = unit_list_2[j]
    _marker = marker_list_2[j]
    feature = feature_df_lowest[_feature_name]
    func = np.polyfit(feature, weight, 1)
    weight_pred = np.polyval(func, feature_df_min[_feature_name])
    r2 = r2_score(weight, weight_pred)
    _ax.plot(feature, weight, 'o',

Shared colorbar
fig = plt.figure(figsize=(24, 6))
fig.subplots_adjust(hspace=0.3, wspace=0.25)
ax_pca = fig.add_subplot(1, 3, 1)
ax_pca.scatter(feat_pca[:, 0], -feat_pca[:, 1], c=eva_p, cmap=plt.cm.viridis)
ax_pca.set_xlabel("Latent Variable 1")
ax_pca.set_ylabel("Latent Variable 2")
ax_pca.set_title("PCA")

ax_kpca = fig.add_subplot(1, 3, 2)
ax_kpca.scatter(feat_kpca[:, 0], feat_kpca[:, 1], c=eva_p, cmap=plt.cm.viridis)
ax_kpca.set_xlabel("Latent Variable 1")
ax_kpca.set_ylabel("Latent Variable 2")
ax_kpca.set_title("KPCA")

ax_umap = fig.add_subplot(1, 3, 3)
sm = ax_umap.scatter(feat_umap[:, 0], feat_umap[:, 1], c=eva_p, cmap=plt.cm.viridis)
ax_umap.set_xlabel("Latent Variable 1")
ax_umap.set_ylabel("Latent Variable 2")
ax_umap.set_title("UMAP")

fig.subplots_adjust(right=0.9)
cbar_ax = fig.add_axes([0.93, 0.15, 0.015, 0.7])
fig.colorbar(sm, cax=cbar_ax)

Gridspec
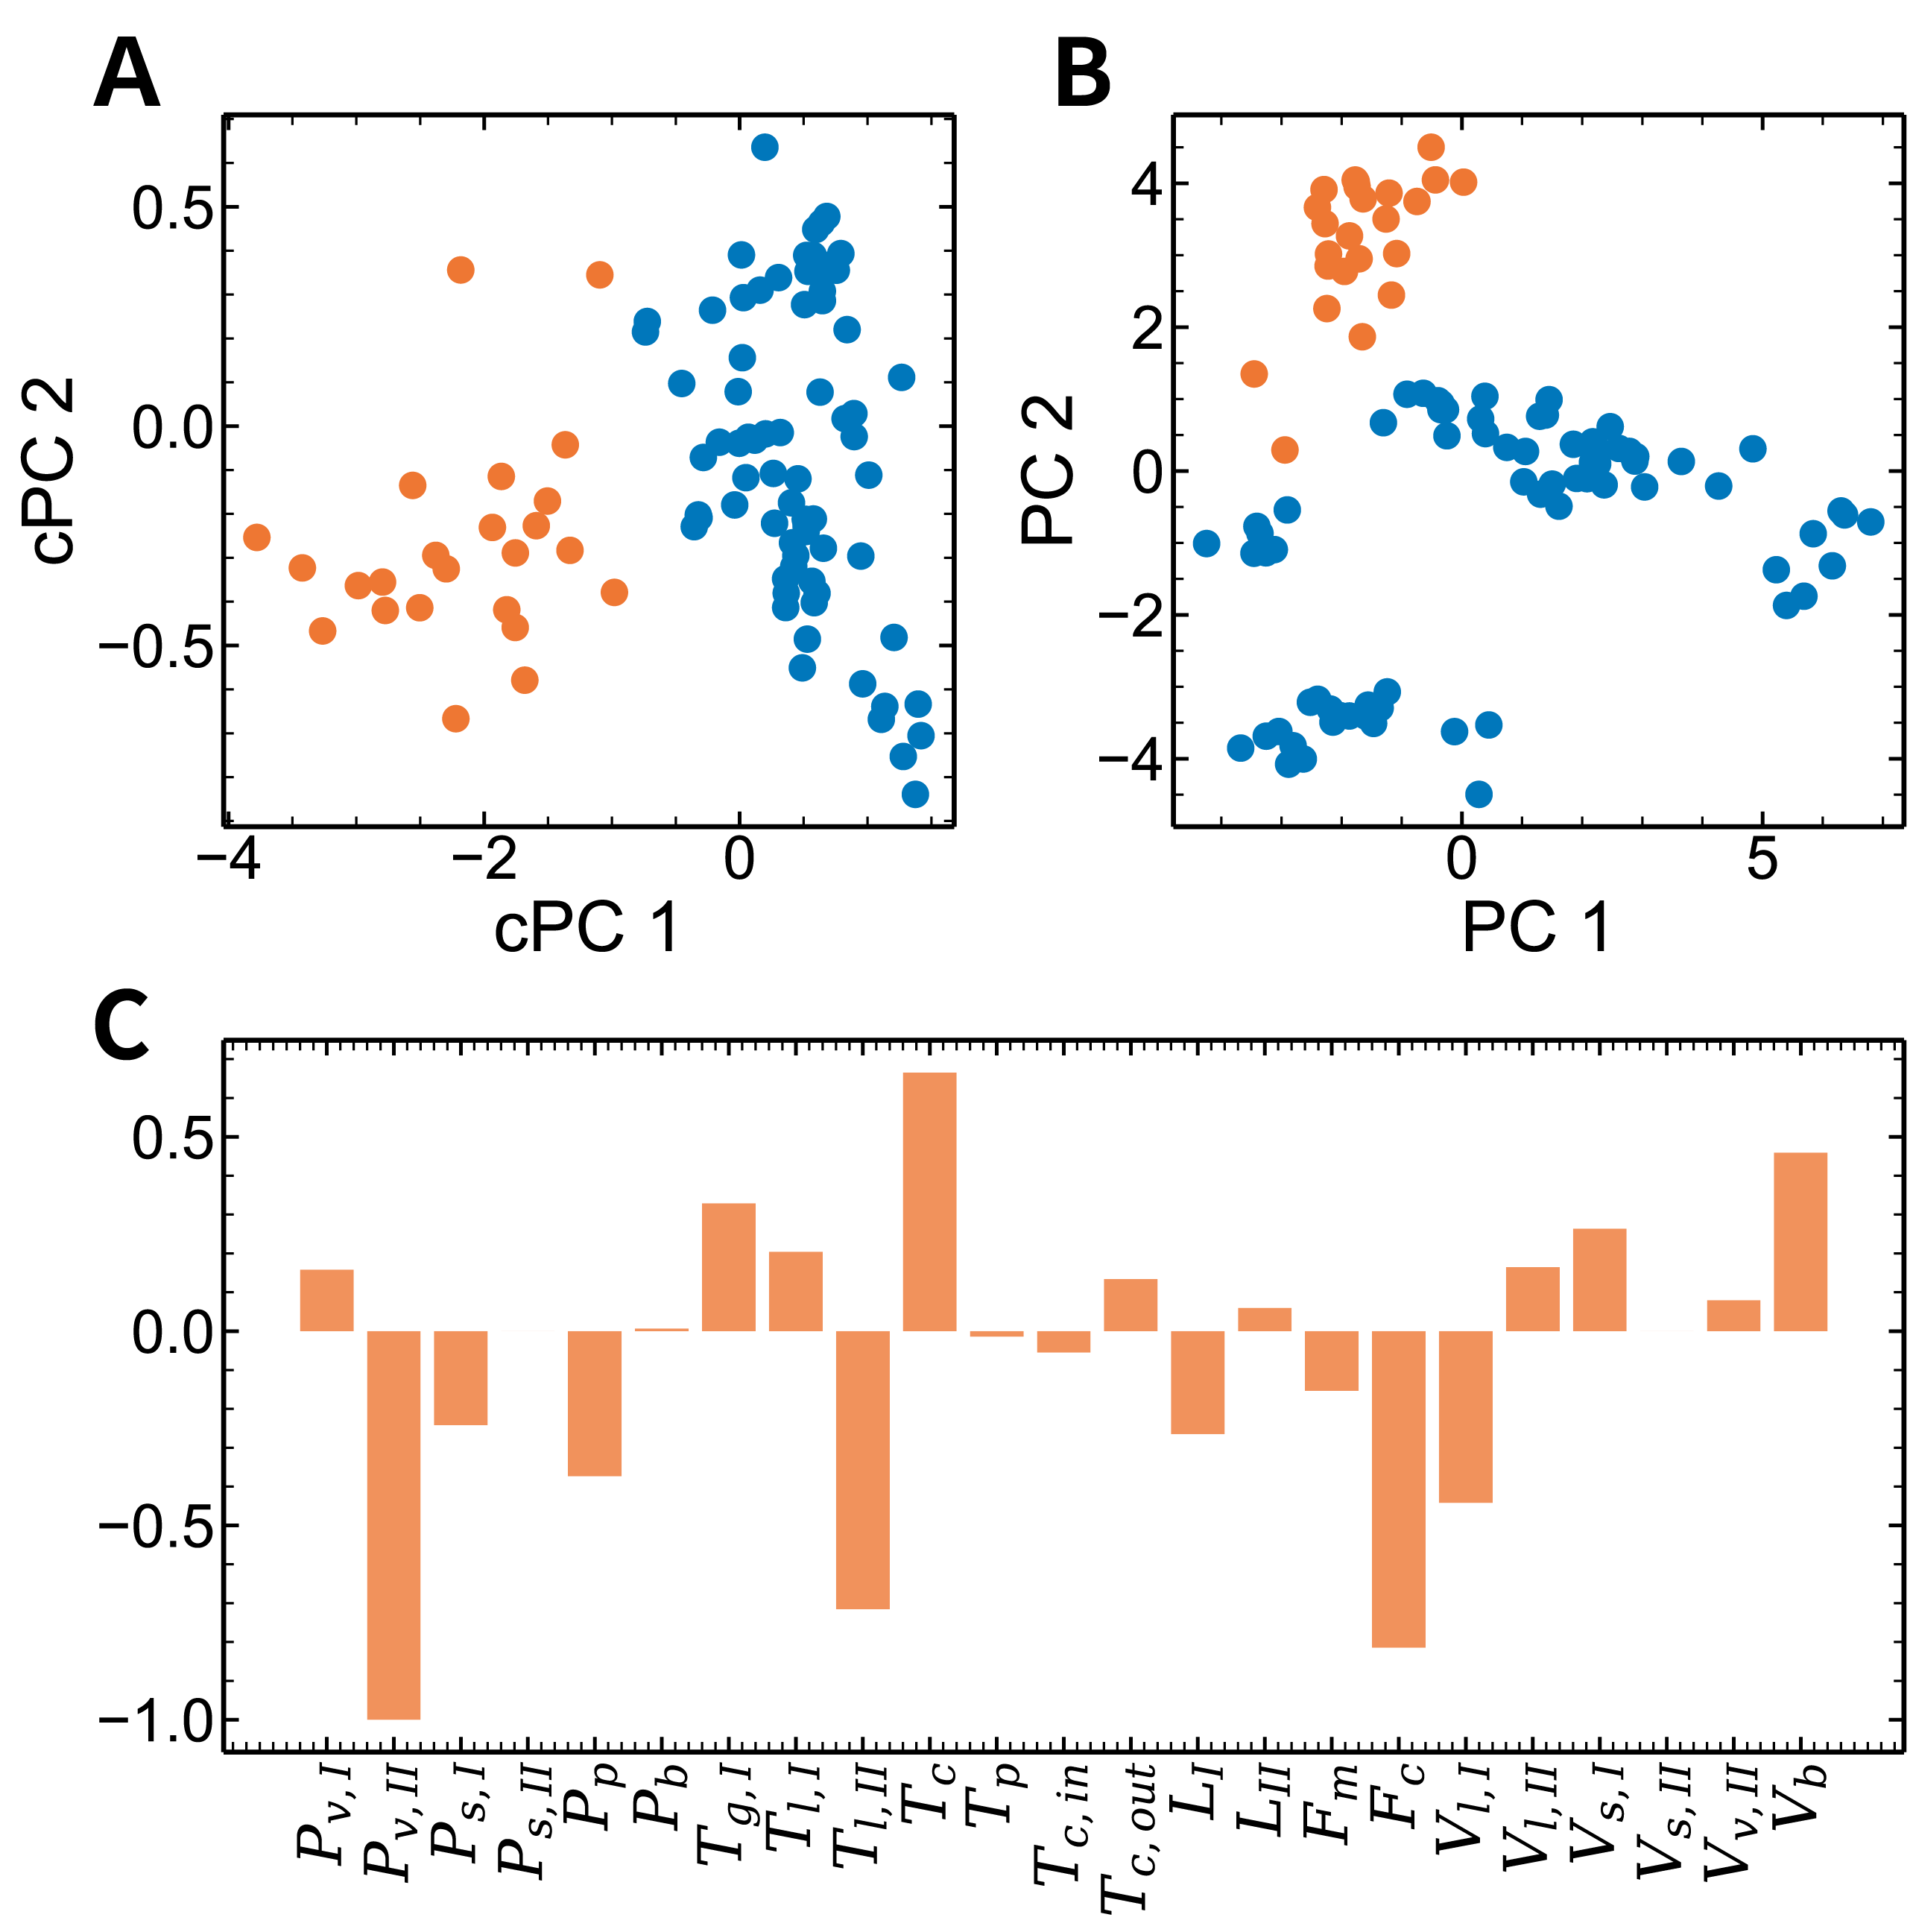
target_label = 4
fig = plt.figure(figsize=(12, 12))
grid = plt.GridSpec(2, 2, hspace=0.3, wspace=0.3)
ax_ccpca = fig.add_subplot(grid[0, 0])
ax_pca = fig.add_subplot(grid[0, 1])
ax_fc = fig.add_subplot(grid[1, :])

ax_ccpca.scatter(ccpca_inner_result[label_inner == target_label, 0],
                 ccpca_inner_result[label_inner == target_label, 1],
                 label="target")
ax_ccpca.scatter(ccpca_inner_result[label_inner != target_label, 0],
                 ccpca_inner_result[label_inner != target_label, 1],
                 label="background")
ax_ccpca.set_xlabel("cPC 1")
ax_ccpca.set_ylabel("cPC 2")

ax_pca.scatter(pca_inner_results[label_inner == target_label, 0],
               pca_inner_results[label_inner == target_label, 1],
               label="target")
ax_pca.scatter(pca_inner_results[label_inner != target_label, 0],
               pca_inner_results[label_inner != target_label, 1],
               label="target")
ax_pca.set_xlabel("PC 1")
ax_pca.set_ylabel("PC 2")

xticks = [
    r'$P_{v,I}$', r'$P_{v,II}$', r'$P_{s,I}$', r'$P_{s,II}$', r'$P_p$', r'$P_b$', r'$T_{g,I}$',
    r'$T_{l,I}$', r'$T_{l,II}$', r'$T_c$', r'$T_p$', r'$T_{c,in}$', r'$T_{c,out}$', r'$L_I$',
    r'$L_{II}$', r'$F_m$', r'$F_c$', r'$V_{l,I}$', r'$V_{l,II}$', r'$V_{s,I}$', r'$V_{s,II}$',
    r'$V_{v,II}$', r'$V_b$'
]
plt.bar(range(23), fc_inner.ravel(), alpha=0.8)
plt.xticks(range(23), xticks, rotation=90)

Uneven axes
fig = plt.figure(figsize=(18, 12))
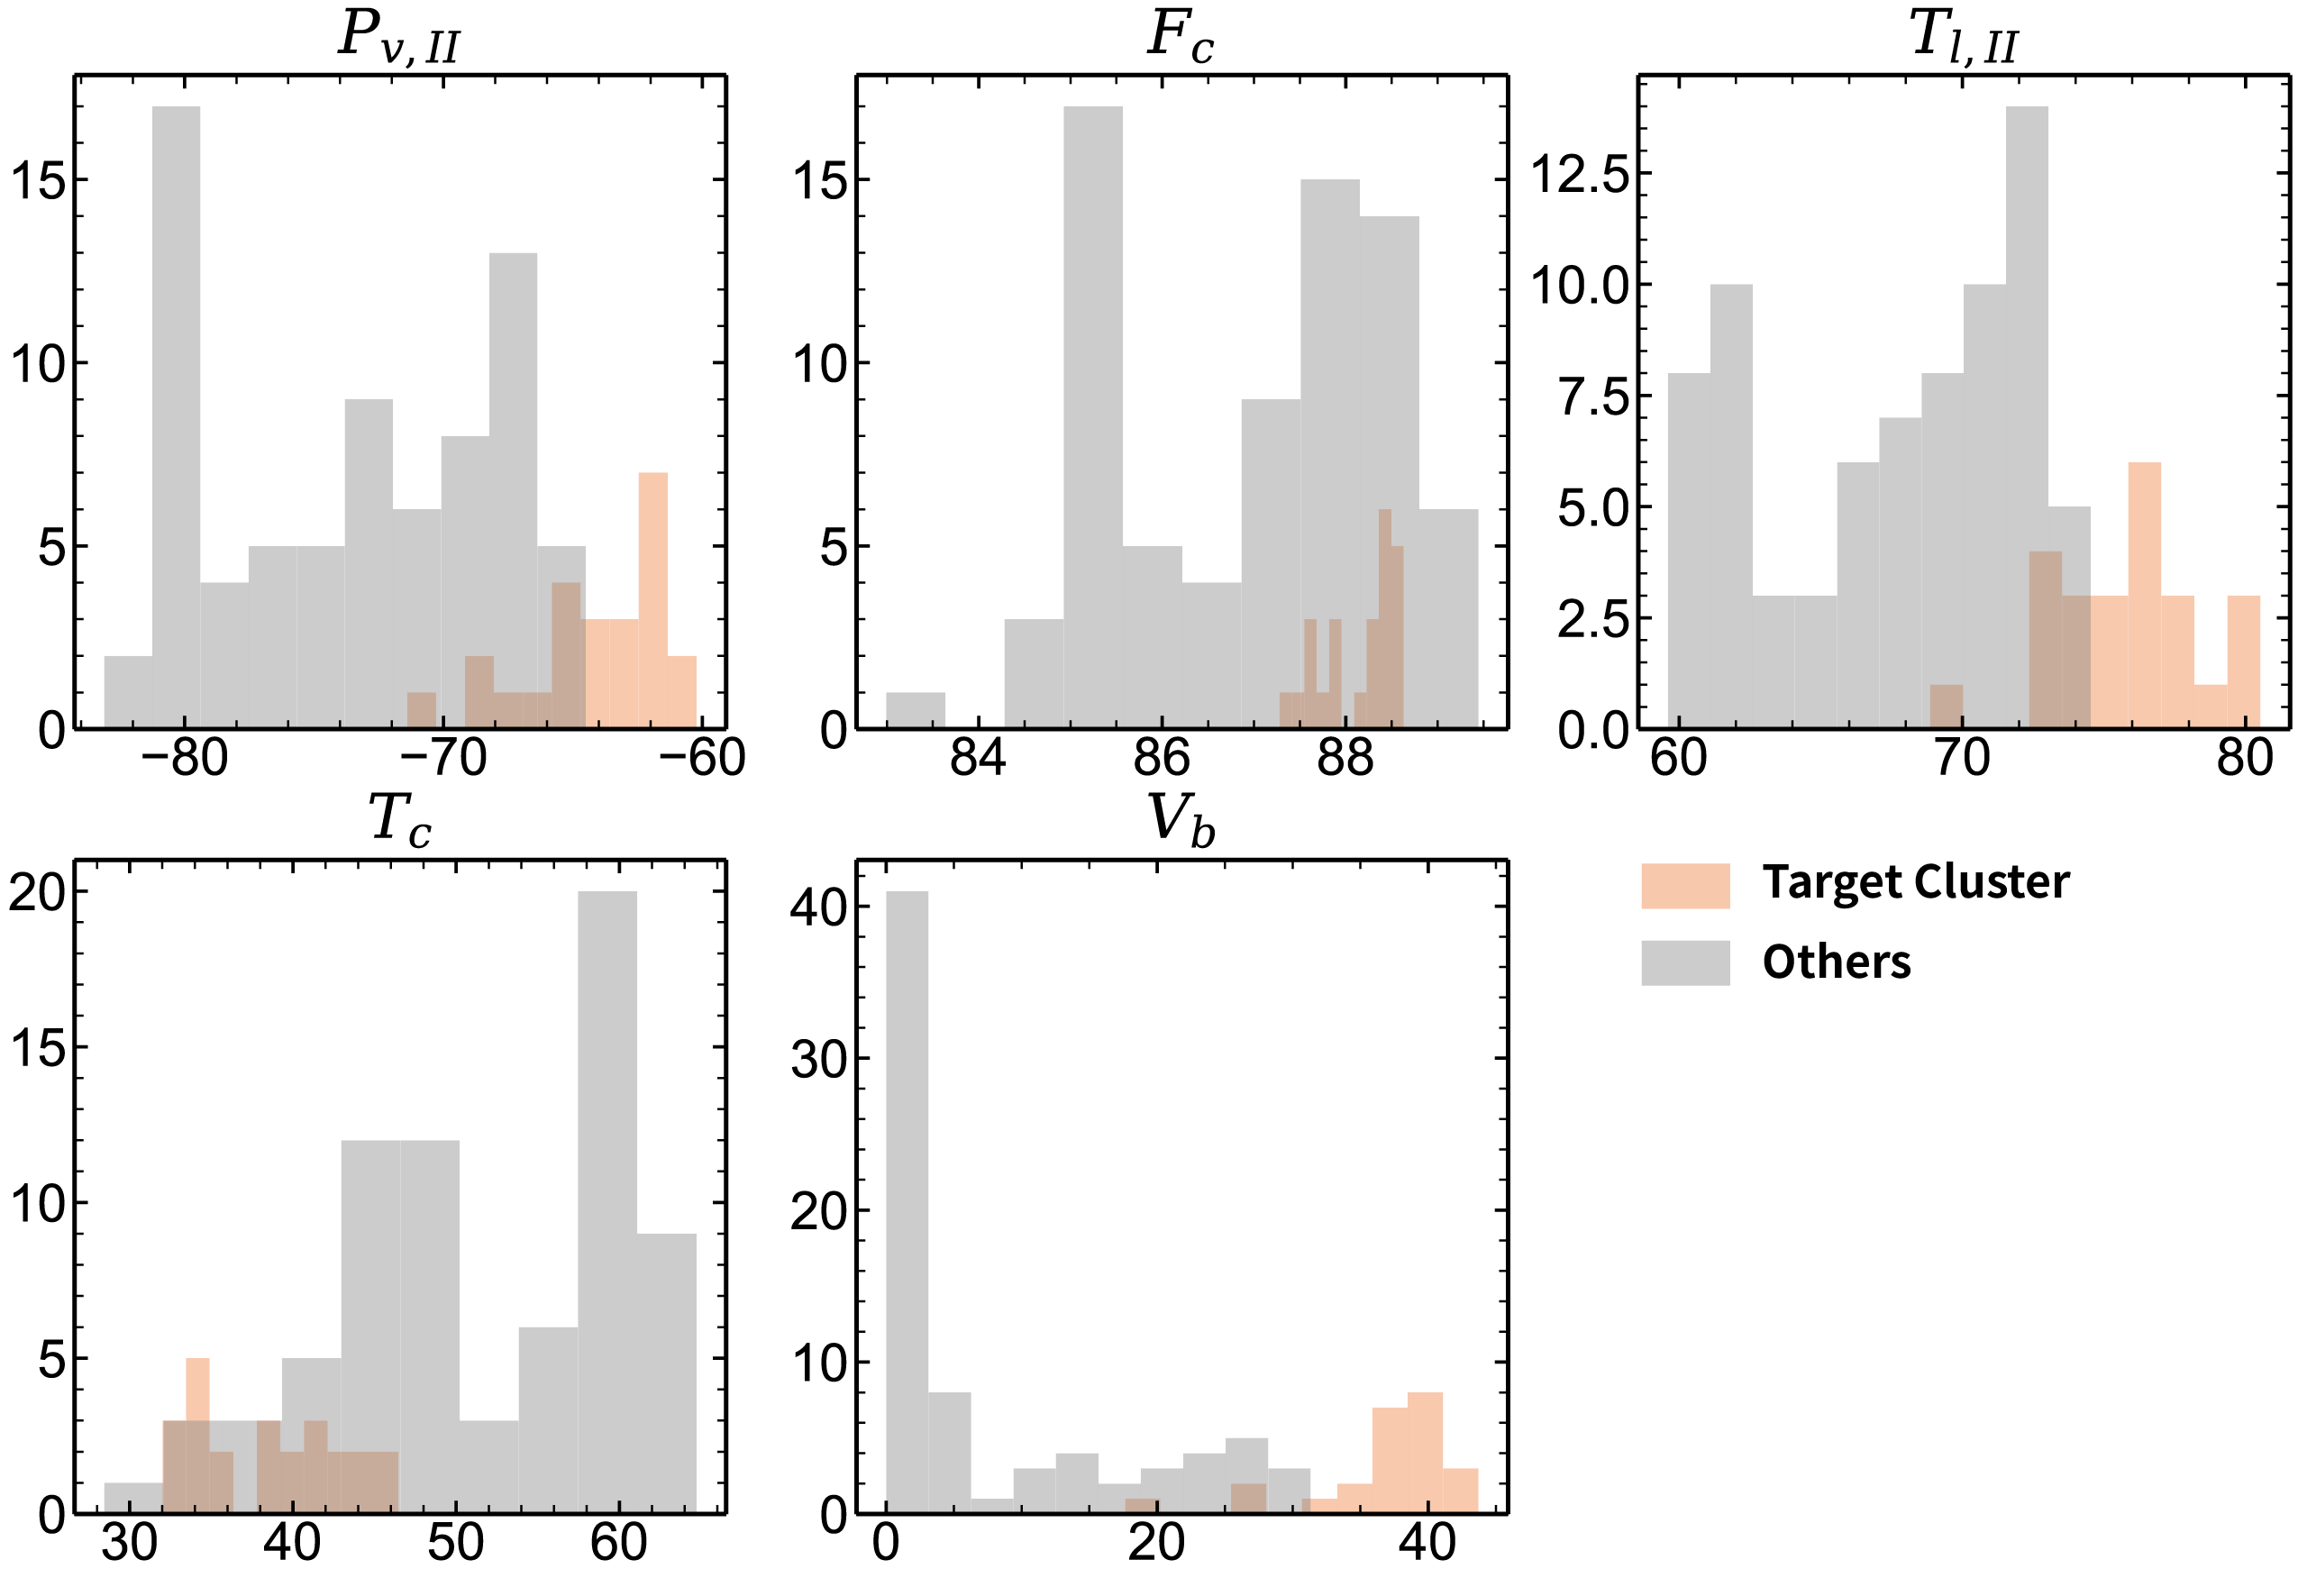
ax1 = fig.add_subplot(2, 3, 1)
ax2 = fig.add_subplot(2, 3, 2)
ax3 = fig.add_subplot(2, 3, 3)
ax4 = fig.add_subplot(2, 3, 4)
ax5 = fig.add_subplot(2, 3, 5)

for i in range(5):
    eval(f"ax{i+1}").hist(feature_inner_raw[label_inner == target_label, first5_index[i] - 1], color="#EE7733", alpha=0.4)
    eval(f"ax{i+1}").hist(feature_inner_raw[label_inner != target_label, first5_index[i] - 1], color="grey", realpha=0.4)
    eval(f"ax{i+1}").set_title(xticks[first5_index[i] - 1])

Qualitative colormap, annotation
fig = plt.figure(figsize=(10, 6))
ax = fig.add_subplot(1, 1, 1)
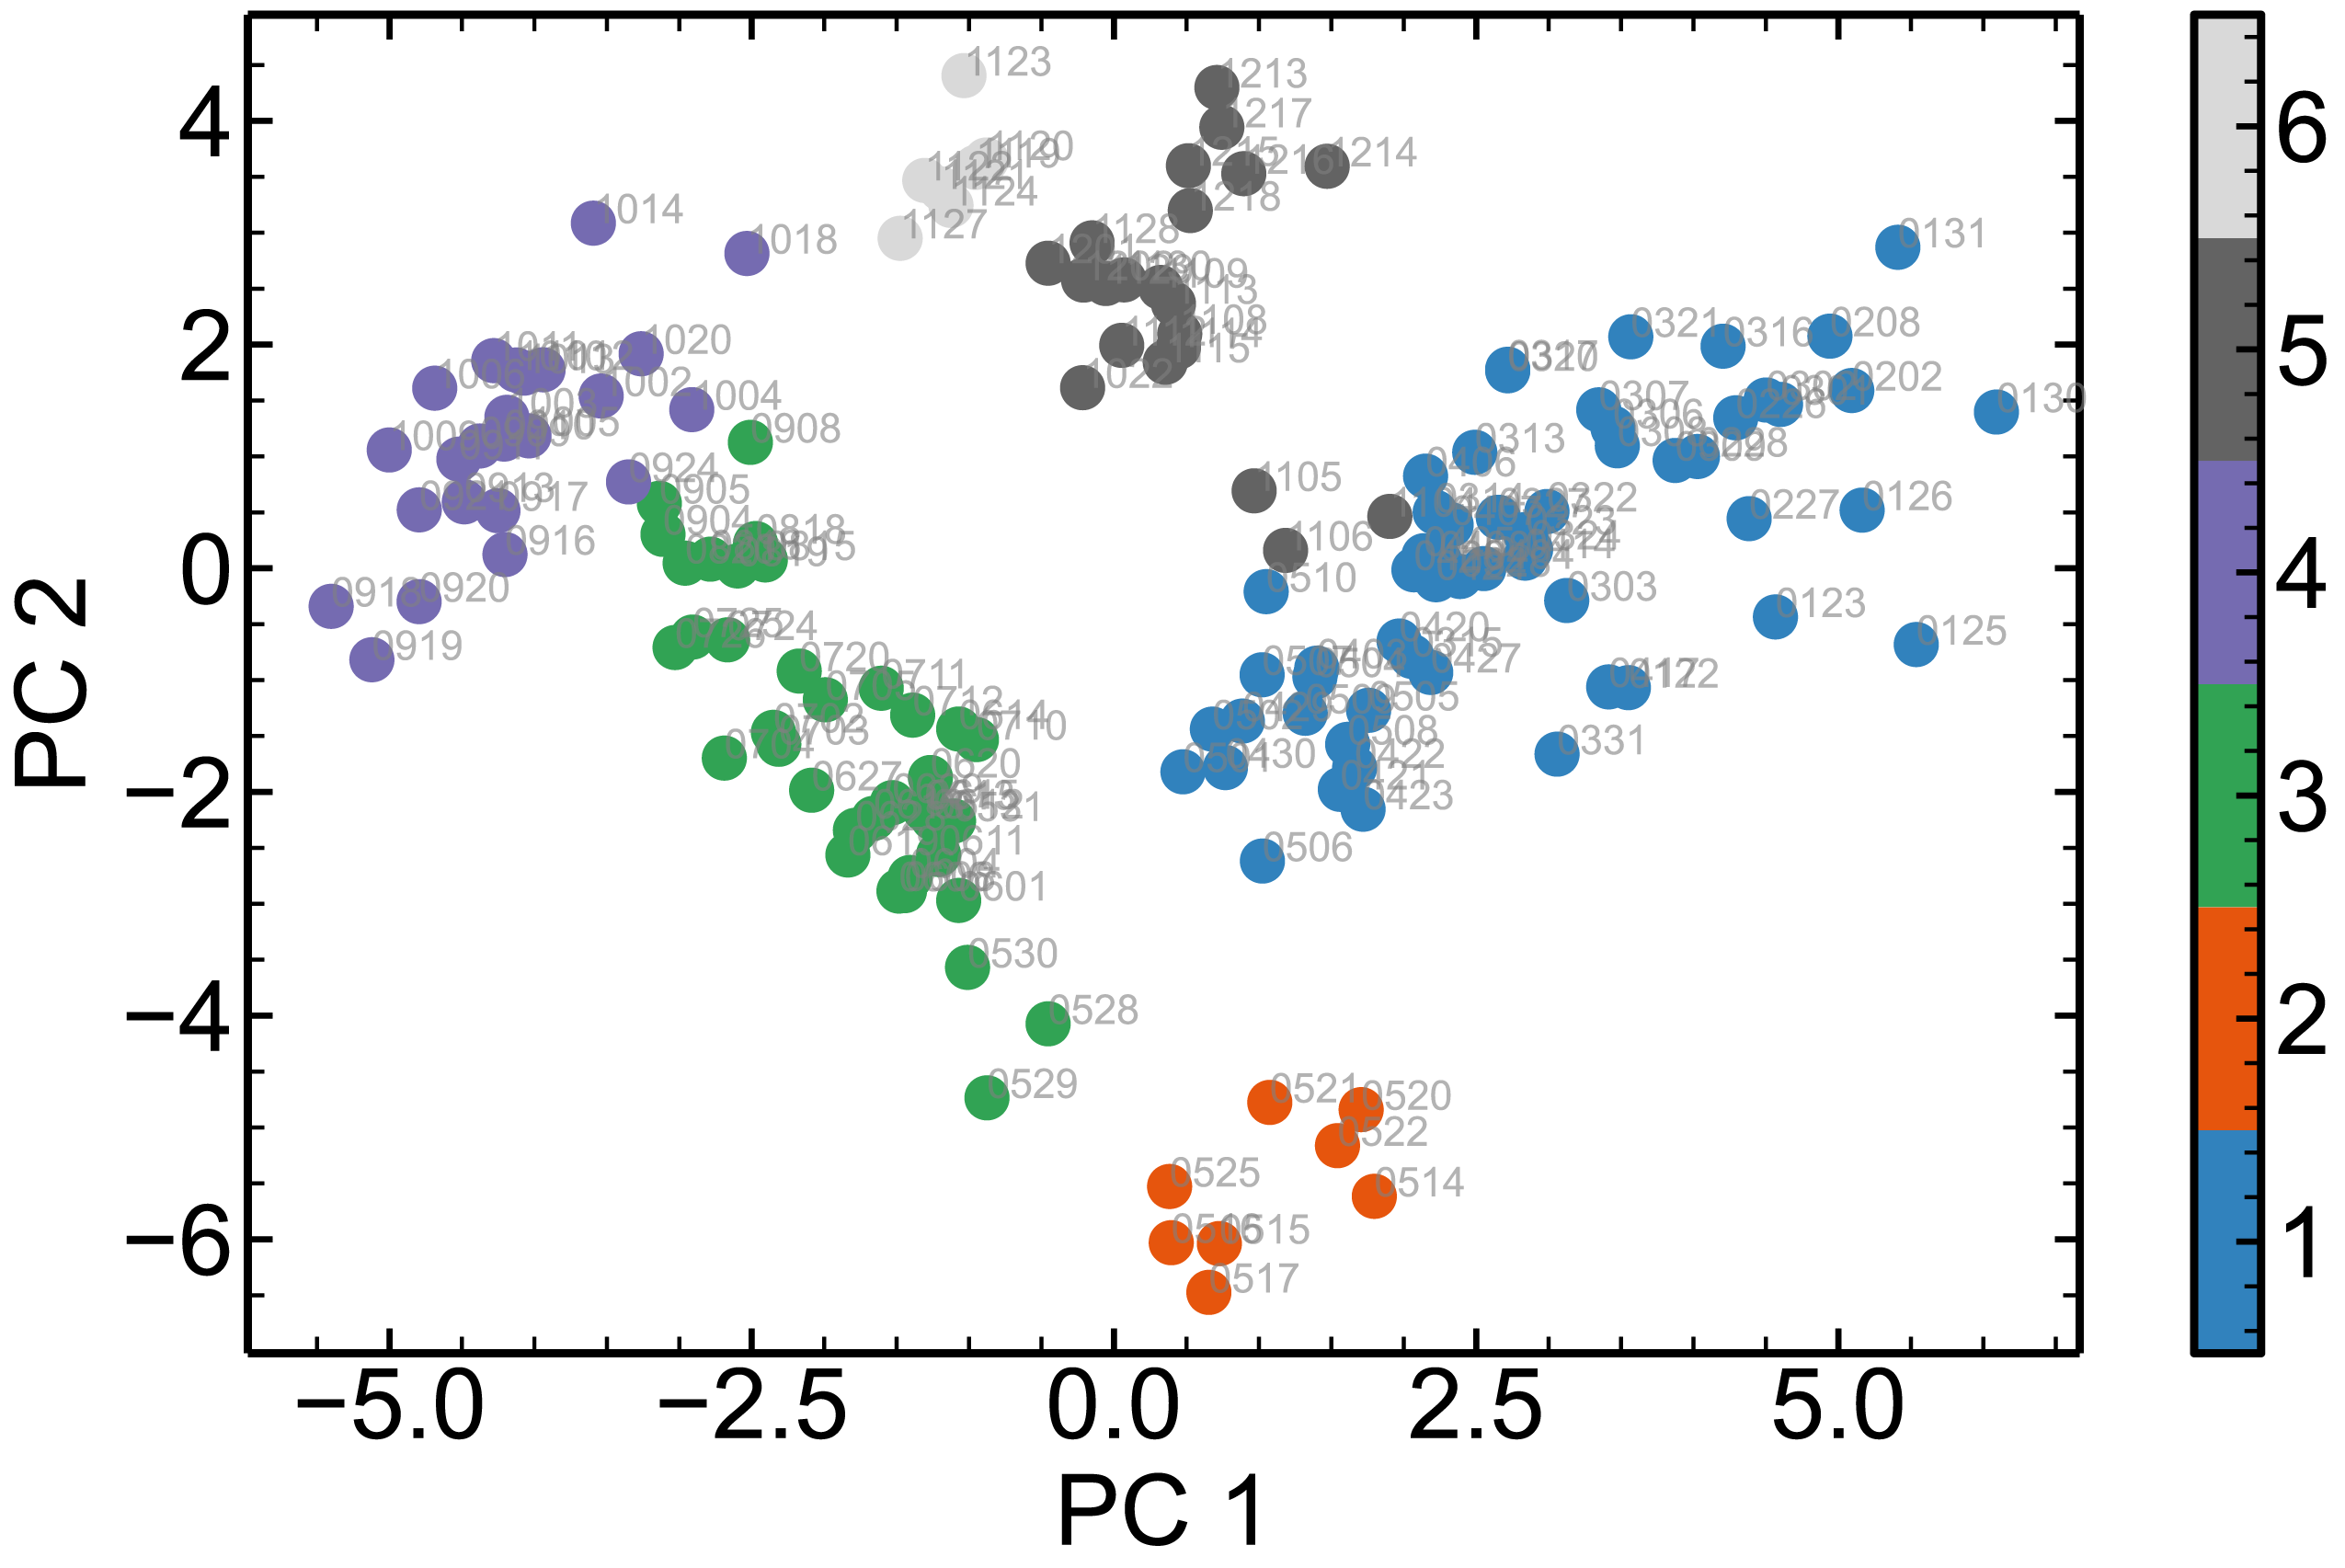
plt.scatter(feat_pca[:, 0], -feat_pca[:, 1], c=label, cmap=plt.cm.get_cmap("tab20c", 6))
for i, item in enumerate(batch_name):
    ax.annotate(item, (feat_pca[i, 0], -feat_pca[i, 1]), c='grey', alpha=0.6)
plt.xlabel("PC 1")
plt.ylabel("PC 2")
plt.colorbar(ticks=range(1, 7))
plt.clim(0.5, 6.5)

Color bar, scalarmappable
lower_bound = data["moisture/%"].min()
upper_bound = data["moisture/%"].max()
moisture_normalized = (data["moisture/%"] - lower_bound) / (upper_bound - lower_bound)

for i in range(data.shape[0]):
    plt.plot(wavelength, data.iloc[i, 5:], c=plt.cm.RdYlBu(moisture_normalized.iloc[i]))
norm = plt.Normalize(vmin=lower_bound, vmax=upper_bound)
ax = plt.gca()
plt.colorbar(
    plt.cm.ScalarMappable(
        norm=norm,
        cmap=plt.cm.RdYlBu,
    ),
    ax=ax,
)
plt.title("Orginal Spectra")
plt.xlabel("Wavelength/nm")
plt.ylabel("Absorbance")


